On risk, uncertainty, and the humanity of science
I was at a dinner party once and the man across from me asked me what I did for work. I told him I was a scientist. He immediately began challenging me, to see what I know, if I was the “real deal.” I’m used to this, it happens often. But this time the conversation turned. How do we know what will happen? How do we know with such certainty who will get sick? He was quite upset.
I told him about risk. About probability. That no one can be 100% certain. Health—and life—is all about risk, not guarantees. It turns out he’d had quite a battle with cancer. He said his doctor told him he never should have had cancer. He had no “cancer genes.” I don’t know exactly how that conversation with his doctor went down, but he clearly walked away with the notion that cancer is genetic, his doctor was baffled he got it, and therefore science, and scientists, are wrong.

We see this same messaging around certainty in daily headlines: Eat this one food to live longer! 10 easy steps to a healthier you! I’ll tell you the same thing I tell my family: if it sounds too good to be true, it almost certainly is. But we’re drawn to the flashy headline. A simple answer to a complex problem. In health especially, things just don’t work that way. Even if there was one food that helped someone live longer, or miraculously “cured” their cancer, there is a slim chance it would work the same for everyone. An infinitesimal chance. Why? Because beyond genes, a lifetime of experiences shape how our cells and tissues respond to the world around us. We’re all different. By genetics, by environment, by timing.
We all know someone who seems to defy the odds. That person who can eat anything without putting on weight, or the relative who smoked and drank into their nineties with nary a health issue. These outliers don’t invalidate the evidence; they simply remind us that we’re all different, and that population averages do not map onto our individual experiences.
“We’re all different. By genetics, by environment, by timing.”
Medicine learned this the hard way in women’s cardiovascular disease care: after decades of excluding women from most research, heart disease treatments built on male-dominated data behaved differently in women. To the extent that beneficial drugs for men worsened outcomes and increased risk of death in women. This is a very extreme example, but variability shows up everywhere, which is why we talk about risk, rather than certainty. While the headline may sound simple, our experiences rarely are.
Risk, uncertainty, and what evidence means
There are many things we accept as “scientific fact.” But even in science textbooks facts are often an over-simplification, or can reflect just one side of a still-debated topic in the field. In biomedicine especially, layers of human variation make it difficult to see the signal through the noise. To understand the actual risk rather than a neat story. Let’s get into what makes this so complicated.
Suppose a study compares cancer rates in people who eat blueberries versus those who don’t. The scientists find that non-blueberry eaters have twice the cancer rate of those who do. Headline: Blueberries Prevent Cancer!
But this was simply an observation, a correlation. It doesn’t prove blueberries prevent cancer. Maybe blueberry eaters also exercise more. Maybe they have quite different diets overall. Or maybe they smoke less. These related differences (called confounders) could be driving the patterns we see between groups. A well-designed research study will measure and adjust for those differences, which would strengthen the results and the conclusions we could draw from them. Even so, more sophisticated long-term studies or basic science research would would be necessary to speak to whether blueberries actually prevent cancer.
Uncertainty is built into science. When researchers test whether an effect is likely real they perform statistical analyses that assess how unlikely it is that the results could be found by chance. Across nearly all of science, the accepted level of uncertainty in these analyses is less than 5%. We report this as a probability value, or p-value. If the p-value is less than 5% (p<0.05), we interpret this as a statistically significant effect, meaning that the patterns observed in the data would be unlikely to arise from chance alone. In association studies, researchers also report the range of plausible values for the size of the effect (the 95% confidence interval). This reflects both how strong the relationship might be and how much uncertainty there is. But together, these numbers simply tell us about the likelihood and uncertainty in the data; they are not a stamp of proof.
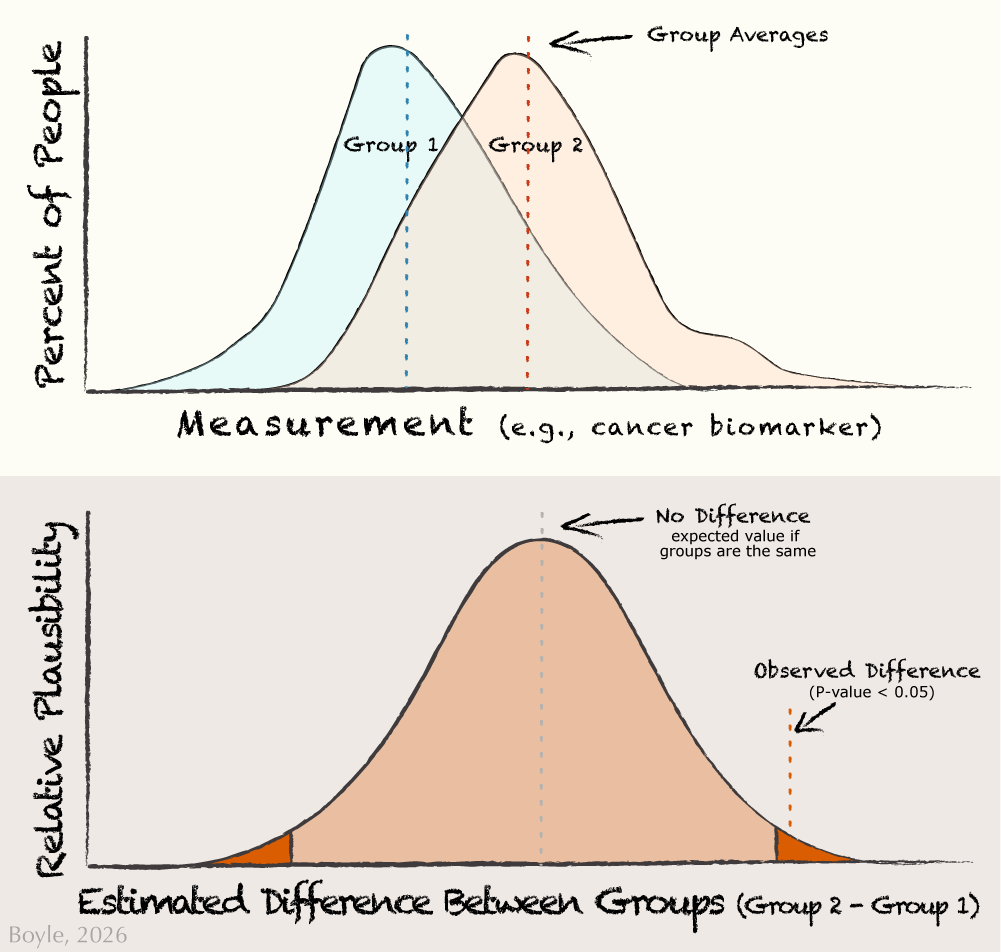
Two things can be true at once: groups can differ on average and still overlap a lot person‑to‑person. The top panel shows the actual measurements for a cancer biomarker in two groups. You can see that even when the averages of the groups differ, most people still overlap. The bottom panel shows the statistical uncertainty about the differences between the two groups. The center dashed line represents no difference. Most values near the center are quite plausible, while values far to the left or right are increasingly unlikely. The shaded outer regions (5% total) mark differences that would be rare if chance alone were responsible. When the red ‘observed difference’ line falls within one of these tails, it indicates a significant difference between groups.
In the top panel of the figure above most people still overlap, even if there is a significant difference between groups. People at the far right of Group 1 (blueberry eaters) look quite similar to Group 2 (non-blueberry eaters). This is why we talk about risk, not guarantees. But how do we find the signal through all this noise? Confidence in these effects builds over time. Over multiple research studies from different researchers using different methods in different places with different people. We also gain confidence when we see that more exposure leads to greater effects, when exposure precedes disease, and when the underlying biology is plausible, perhaps from basic science research. This is why we can say with confidence that smoking can cause cancer: there is consistent, replicated, timely, strong data supporting this effect.
By contrast, a single blueberry study cannot carry the same confidence. This is why we see headlines that flip: “Coffee is good for you!” then: “No, put down that coffee!” The biology didn’t change overnight, the context did. Different people, different places, different methods. Only by looking across studies, in systematic reviews of literature or meta-analyses that pool results, can we begin to draw conclusions about the overall signal. This is what it means to be evidence-based: An entire body of evidence, not a single piece.
“Science is not certainty, science is human”
But even then, someone will defy the odds. Yes, there are people who smoke who do not get cancer. This isn’t failure or faulty science. This is what it means to be human. And this speaks to risk. Risk is a tendency, not a promise. The smoker who never gets cancer falls into the 5% of accepted uncertainty in science.
Of course I didn’t get to discuss all of this with my dinner companion. But if I had the chance to talk with him again, here’s what I would say: Science is a process. It is a journey, not a destination. And rarely should we say, with absolute certainty, you should never had had cancer.
Why Timing Matters
I study risk. Our risk for chronic diseases like heart disease, diabetes, or obesity can begin long before most of us would imagine. For nearly twenty years, my group has studied how early-life influences shape our lifelong health. Scientists often refer to this as the first 1,000 days, from conception to about age 2. This is a window of rapid growth and rapid change. And signals from our environment, in utero and in infancy, can shift health trajectories across the lifespan.
These shifts are not preordained, and it is not easy to determine which exposure contributes to which health outcome. We’re trying to figure that out. Some call these effects “programming”, but that feels too deterministic to me. These shifts in our health trajectory are simply a nudge. One that can be reinforced or tempered by later life experiences.
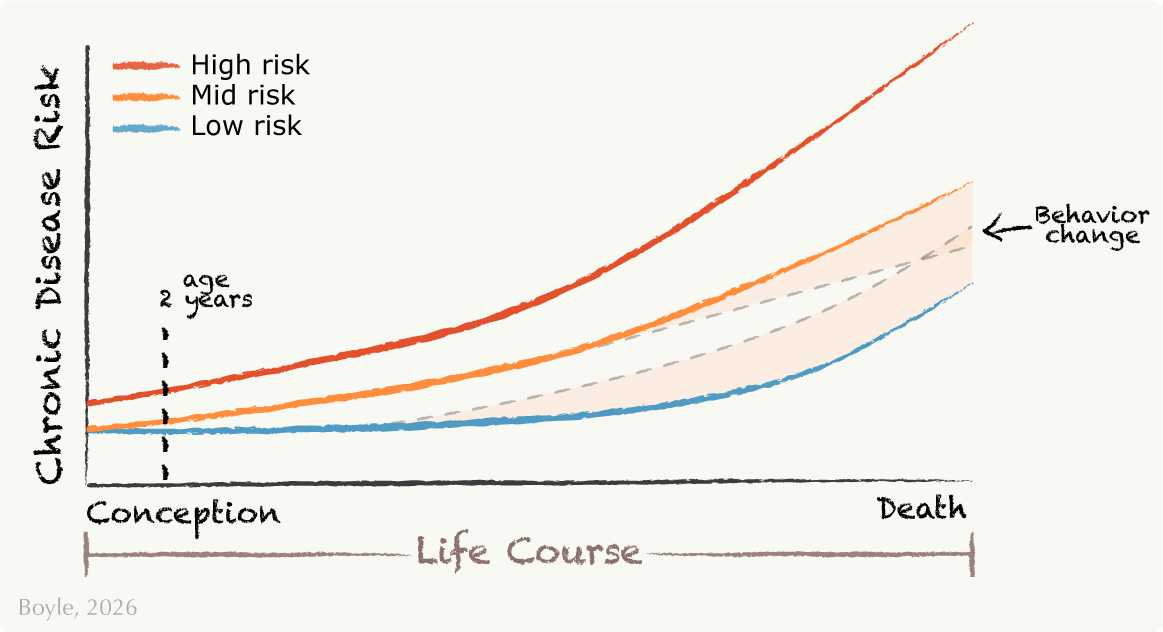
This graph, adapted from Godfrey et al.,1 shows examples of people with low, mid, and high risk for chronic disease over the life course. In addition to genetics, the first 1,000 days, from conception to about age two, can be especially formative. Early experiences like nutrition, stress, or environment can shape these health trajectories. Behavior changes later life can reinforce or reverse those nudges, indicated by shaded regions. For example, changing your diet or stress levels, or beginning certain medications, can increase or decrease your disease risk.
To investigate these early life patterns, my lab uses infant progenitor cells collected from their umbilical cords when they’re born. We use these cells to unravel the early shifts in our health trajectories, long before disease begins. We investigate how these cells respond to stressors, how they relate to in utero exposures, and how those early responses relate to later risk for metabolic diseases, such as obesity or diabetes. Through this work, we hope to identify which signals matter, for whom, and when. So that we can better understand who is at risk and, ultimately, how to help.
Embracing Uncertainty
In my last essay, I discussed work by Gambal and Matthews, who argue that even though scientific literacy can support our knowledge, agency, and decision making, our choices are often grounded in emotion, not rational evaluation. Flashy headlines promise certainty and our brains love it! Because uncertainty is uncomfortable.
But science is not certainty, science is human. Pretending otherwise undermines our trust in science and, ultimately, our trust in the truth. Until we present science as it is, contextual, collaborative, and at times uncertain, we will not be able to move past the noise. No one has all the answers. If they pretend they do, pay attention to their agenda. Is it money? Clicks? Persuasion?
I’m writing against the grain. I will not give you flashy, one-size-fits-all answers. Expect less noise and more signal: honesty about uncertainty, clarity about risk, and a way of thinking about science that embraces its uncomfortable complexities.
Up next: Progenitor cells: what they are, why they matter, and how they may shape our health from our earliest beginnings.
Kristen Boyle, PhD
Dr. Boyle is a scientist, writer, and professor at the University of Colorado Anschutz School of Medicine, where she leads the Molecular Health Lab. Her group studies how early life shapes lifelong health. She writes about science, health, truth, and humanity.
Linked References
- Godfrey KM, Gluckman PD, Hanson MA. Developmental origins of metabolic disease: life course and intergenerational perspectives. Trends Endocrinol Metab. 2010 Apr;21(4):199-205. doi: 10.1016/j.tem.2009.12.008. Epub 2010 Jan 14. PMID: 20080045. ↩︎